India’s Smart Cities Mission, running from 2015 to 2025, involves US$20+ billion in funding for 100 cities, delivering projects in smart water, transport, and governance. Thousands of initiatives are underway, including sensor-based safety systems. For investors, this mission introduces scalable opportunities in infrastructure-backed wealth preservation. Tax incentives, including exemptions for specific public–private partnerships, make entry more favorable. With privacy policies evolving, data rights remain under active debate. The program’s wide scope positions Indian urban real estate as an enduring value anchor tied to sustainability.

The City of Sedona has implemented new, stricter licensing requirements for short-term rentals (STRs), including mandatory safety inspections and enhanced noise monitoring. These regulations respond to local community concerns but also increase the compliance burden for STR investors. From a wealth management lens, these tighter rules may favor professional operators over casual hosts, potentially consolidating the market and stabilizing nightly rates. Pinal and Yavapai counties are also considering similar "good-neighbor" ordinances. Tax revenue from STR occupancy continues to fund local infrastructure, though some municipalities are debating new "impact fees" for rental properties. Smart-city technology, such as automated decibel monitoring and digital registration portals, is being used to enforce these new standards.
Sun City home prices were up 0.6% year over year in August 2025 with a $266,500 median and 91 days on market. Sun City West’s median was $359,000, down 3.6%, with 89 days on market. Sun City Grand recorded a $419,000 median, down 5.2%, with 98 days on market. Arizona’s statewide median sale price was $441,200 with 72 days on market and sales up 2.6% year over year. Wealth management reviews should weigh renovation reserves for HVAC and envelope upgrades typical of older stock. Maricopa County’s overall property tax rate eased to 1.348 for FY 2026, supporting cash-flow stability for retirees. Listings spending 60+ days have increased across Phoenix, sharpening negotiation leverage on condition credits. Mortgage rates near 6.35% improve purchasing power relative to January. Community governance and age-specific amenities remain differentiators for maintenance and insurance profiles. For value durability, golf-proximate parcels with refreshed systems tend to clear faster than dated comparables. Sustainability angles favor homes with upgraded insulation and high-SEER systems in heat-exposed submarkets. Buyer concessions remain most common on properties needing capital work. Inventory turnover varies by village and HOA covenant stringency. Seller response times lengthen as seasonal inventory builds into Q4.
Sedona recorded a median home price of $920,000 in August 2025, with days on market averaging 61, reflecting a high-value but slower turnover environment. Prescott, by comparison, posted a $525,000 median with 48 DOM, signaling active mid-tier demand. For investors, Sedona represents a stable luxury asset class with strong lifestyle premiums, while Prescott offers liquidity at lower entry points. Property tax implications differ sharply between Yavapai County’s valuations, influencing estate planning. Local zoning ordinances in Sedona limit short-term rental density, moderating speculative activity, while Prescott advances sustainable forestry management in building codes. Both markets project steady 20-year population inflows, balancing long-term value resilience.
Prescott has seen $60 million in new health and wellness facility construction in the past year, responding to increased in-migration and retirement. These projects are tax-advantaged and enjoy municipal incentives for medical uses. Updated regulatory guidance mandates energy and seismic upgrades, promoting long-term building performance and sustainability.
Phoenix’s purchase marks a concrete step in the “Rio Reimagined” program involving Avondale, Buckeye, Mesa, Tempe, Maricopa County, and tribal partners. The acquired parcel (currently occupied by Ace Asphalt) may be cleared for future mixed-use, public space, or waterfront activation—though design plans are pending. The local segment, called RIO PHX, spans 20 miles. The entire plan is projected to unfold over 25 to 40 years. For investors, this signals commitment to long-horizon catalytic infrastructure. From a tax and municipal finance lens, future incremental value gains will factor into special districts or assessments. Regulatory and land-use coordination will be essential across jurisdictions. In a sustainability sense, visioning around water, habitat, mobility, and open space will influence real-estate outcomes.
Sedona updated its STR regime with a $10 increase to a $210 annual permit fee effective January 10, 2025 and code amendments in 2025 that, among other items, restrict converting newly built accessory dwelling units into STRs, as part of broader efforts to balance tourism and housing availability. Wealth managers operating STR assets should recalibrate operating expense schedules and compliance routines. Tax receipts from licensed STR activity persist, but enforcement curbs nuisance externalities. The regulatory context remains dynamic under state preemption constraints. Value stability favors professionally managed, compliant units. Smart-city themes include data-driven enforcement and neighborhood preservation.
A September 2025 update confirmed The Confluence is fully leased as EFP executed a second lease to expand foam molding and distribution, serving local customers including Kohler’s recently opened manufacturing facility; land changes earlier in 2025 opened new industrial sites, with case-by-case site plan reviews required before vertical starts. For wealth allocations, stable occupancy and supplier networks enhance yield visibility. Tax bases deepen as plants and logistics scale. Regulatory posture remains plan-driven with industrial design standards. Value resilience follows employer stickiness and transportation access. Smart-city dimensions include modern manufacturing, cold-chain, and energy-efficient plant operations.

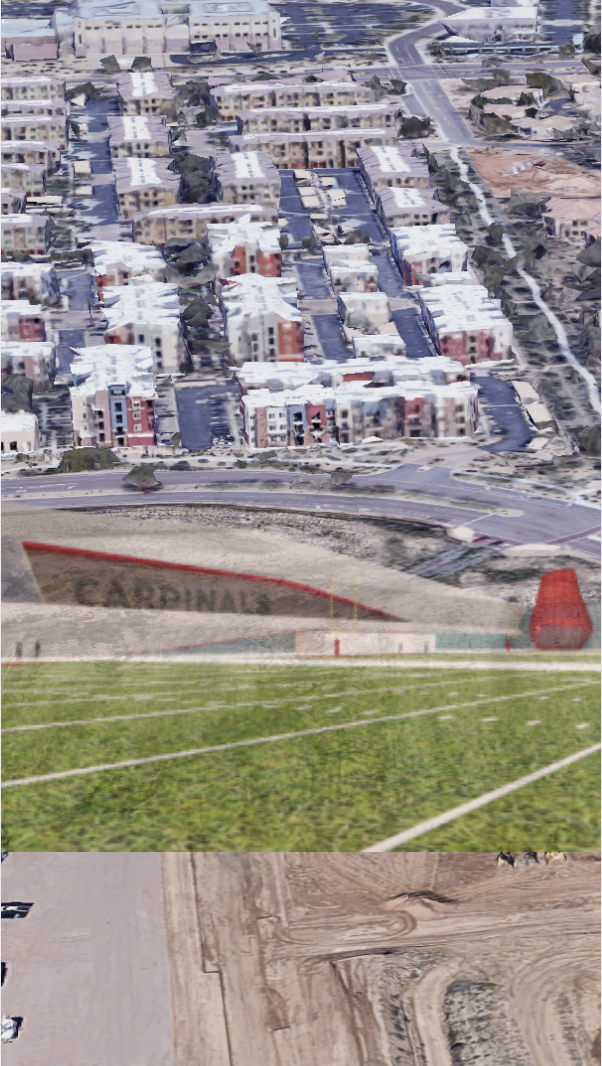 Arizona Cardinals’ $136 Million “Headquarters Alley” Project: How a 217-Acre Deal Will Redefine North Phoenix by 2028
 Public Safety as an Asset Class: The New Scottsdale AdvantageIn today’s Smart City economy, safety isn’t simply about peace of mind—it’s becoming a measurable, marketable asset class. Scottsdale is proving that public safety can be engineered into the fabric of
Nice to meet you! I’m Katrina Golikova, and I believe you landed here for a reason.
I help my clients to reach their real estate goals through thriving creative solutions and love to share my knowledge.