India’s Smart Cities Mission, running from 2015 to 2025, involves US$20+ billion in funding for 100 cities, delivering projects in smart water, transport, and governance. Thousands of initiatives are underway, including sensor-based safety systems. For investors, this mission introduces scalable opportunities in infrastructure-backed wealth preservation. Tax incentives, including exemptions for specific public–private partnerships, make entry more favorable. With privacy policies evolving, data rights remain under active debate. The program’s wide scope positions Indian urban real estate as an enduring value anchor tied to sustainability.

In Q2 2025, Scottsdale’s permit portal shows a marked increase in active cases for mixed-use and multifamily developments, particularly in the Old Town and North Scottsdale corridors. The city’s online tracker highlights over 40 active rezonings and site plan reviews, reflecting strong developer confidence in sustained population growth and premium rental demand. This development surge is significant for wealth management portfolios focused on urban infill and high-density residential assets. Property tax assessments for these projects are expected to reflect their higher-intensity use, though the city continues to offer incentives for "green building" and smart-infrastructure integration. Regulatory oversight remains focused on maintaining Scottsdale’s high aesthetic standards while allowing for increased density near key transit nodes. Future-proof valuation is supported by the city's commitment to high-speed fiber-optic rollout and EV charging mandates in new projects.
The city’s engineering/permitting page notes the updated fee schedule effective September 1, 2025 and directs all plan submittals through the Citizen Portal; public notices in April-July documented the process under A.R.S. §9-499.15. Concurrently, Old Town Avondale improvements advance, including the planned Old Town Plaza park at Western & Dysart and a council-adopted 2025 Strategic Plan to guide growth. For wealth allocation, predictable fees and placemaking bolster underwriting. Tax returns from dining and events complement residential absorption. Regulation aligns with transparent fee law and public outreach. Value stability is reinforced by historic-district upgrades. Smart-city touchpoints include online workflows and public engagement platforms.
Prescott’s multifamily sector is experiencing a period of robust growth, with new apartment complexes nearing completion near the Embry-Riddle and industrial corridors. According to recent data, effective rent climbed 4.9% year-over-year, per Yardi Matrix and local brokerage data. This environment has attracted 1031 exchange investors and high-net-worth buyers seeking income stability. Local legislation has streamlined permitting for workforce housing but introduced new impact fees earmarked for infrastructure. Tax considerations remain central as assessed values rise, impacting depreciation and cash flow models. The city’s ongoing investment in water and wildfire resilience is likely to support the area’s reputation for long-term sustainability.
In September 2025 Peoria’s council discussed zoning changes after passage of state middle-housing legislation to enable duplex-to-fourplex options in more districts, with civic coverage noting the policy shift; the city maintains a monthly permits-issued reporting cadence that details residential, commercial and pool permits for market participants. Wealth management perspectives see diversified entry-price product aiding liquidity. Tax effects include broadened bases and fees. The regulatory context is shifting toward gentle density while preserving design standards. Value resilience is supported by housing type variety. Smart-city framing points to distributed infrastructure load and transit-supportive infill.
Gilbert’s ordinance requires owners to obtain and maintain a Short-Term Rental License and pay a $100 non-refundable fee at application and annually at renewal, with program details administered via the town’s online portal and references codified in municipal code, aligning with statewide STR reforms while preserving local enforcement. Wealth holders operating STRs should model compliance costs and potential yield impact. Tax considerations include TPT obligations layered over local licensing. The regulatory framework targets nuisance prevention and data transparency. Value resilience may favor compliant, well-managed STR inventory. Smart-city angles include digital licensing, complaint tracking, and safety integrations.
Chandler has reached 88% build-out capacity, Gilbert 82%, and Mesa 76%, with August 2025 records showing a 7% year-to-date decline in residential building permits. This signals a shift toward strategic infill projects and adaptive reuse, such as Chandler’s repurposing of vacant retail centers into mixed-use hubs. For wealth portfolios, this reduces reliance on raw land appreciation and emphasizes redevelopment premiums. Tax considerations include recalibrated valuations from adaptive reuses that may alter depreciation schedules. Arizona’s HB2110 on accessory dwelling units is expected to influence smaller-lot redevelopment viability. Long-term stability in these cities is supported by job diversity and strong demographic inflows, while smart-city initiatives, such as Gilbert’s expansion of fiber-optic broadband, support sustainable community growth.
Apache Junction’s Development Services page announces a program providing free residential design plans to support attainable housing options, with links to zoning code updates, maps, and a GIS development tracker. The Zoning Ordinance is centrally posted within the Land Development Code for applicants. Wealth managers and builders can reduce soft costs via standard plans. Taxes and fees accrue as small-lot SFR and accessory projects move forward. Regulatory alignment improves through clearer online code access. Value stability can improve with consistent design standards. Smart-city features include GIS case mapping and digital submittals.

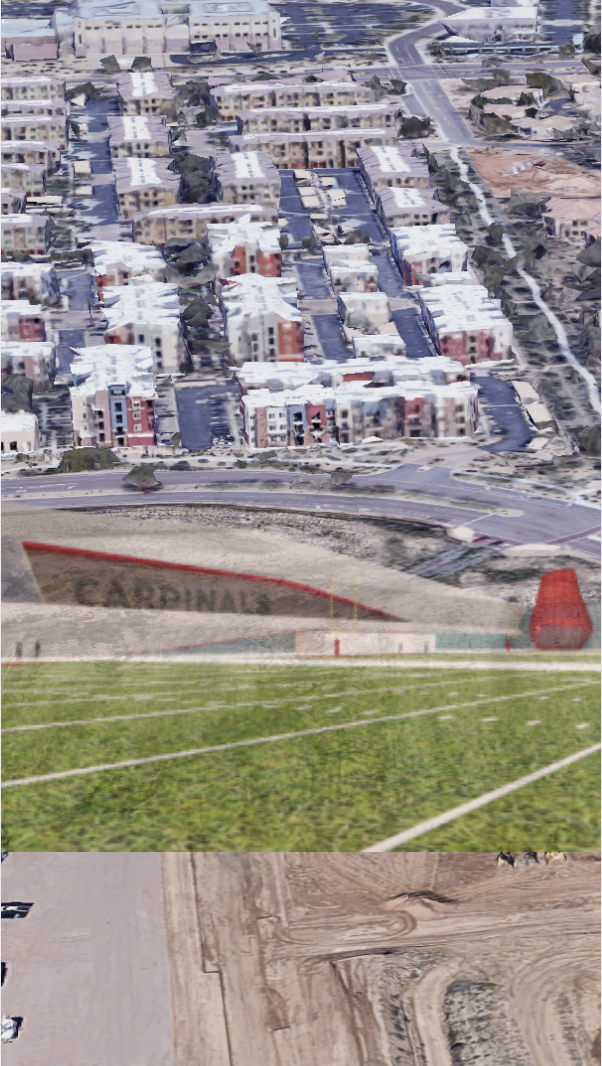 Arizona Cardinals’ $136 Million “Headquarters Alley” Project: How a 217-Acre Deal Will Redefine North Phoenix by 2028
 Public Safety as an Asset Class: The New Scottsdale AdvantageIn today’s Smart City economy, safety isn’t simply about peace of mind—it’s becoming a measurable, marketable asset class. Scottsdale is proving that public safety can be engineered into the fabric of
Nice to meet you! I’m Katrina Golikova, and I believe you landed here for a reason.
I help my clients to reach their real estate goals through thriving creative solutions and love to share my knowledge.